|
Gene Ontology Enrichment |
Enriched Biological Functions of 1026 ROS-Diabetes Targets
Here are the enriched biological functions of 1026 ROS-Diabetes targets in terms of Gene Ontology, pathways, and protein-protein interactions. Comparison was done against the all human genes in the HUGO Gene Nomenclature Committee (HGNC) database.
Quick jump to
(GO Enrichment)
(Pathway Enrichment)
(PPI Enrichment) [ Display Reset ]
|
|
Gene Ontology Enrichment |
Download a compressed file (GO_Compressed.zip (44.6 MB)) including all of the individual GO files. This zip file contains every raw and intermediate files, some of which are available on this web page.
| Corpus size | # of targets (total) | # of targets (used) | |
|---|---|---|---|
| ROS-Diabetes set | 1154 | 1026 | 1026 |
| Background set | 25254 | 25254 |
Gene Ontology Enrichment Section is composed of 9 results. For the three Gene Ontology categories (Biological Processes, Molecular Functions, and Cellular Components), three different sets of Gene Ontology terms are used.
Explicit GO: Only use GO terms that are explicitly assigned to the target gene.
Full GO: Use both explicitly assigned GO terms and implicitly assigned terms. Implicit terms are all the parent terms of explicity GO terms from the GO tree structure.
Level 2~5: Use only the highest 4 levels of GO terms. These can generally provide functional categories due to their broad meanings. GO assignements are based on the full GO.
|
|
Biological Processes |
|
|
Molecular Functions |
|
|
Cellular Components |
|
|
Pathway Enrichment |
The following table summarizes those targets that were used in this pathway enrichment analysis. Pathway information are derived from KEGG and Reactome databases for each target.
| # of targets | # of Targets with pathway info | # of unique pathways | |
|---|---|---|---|
| ROS-Diabetes set | 1026 | 759 | 697 |
| Background set | 25254 | 5116 | 942 |
More full results are available.
| ROS-Diabetes set (all in text file format) | Pathway assignment | Matrix_Type1 | Matrix_Type2 |
|---|---|---|---|
| Background set (all in text file format) | Pathway assignment | Matrix_Type1 | Matrix_Type2 |
Top 10 most enriched Pathways (sorted by p-value)
| # of targets in ROS-Diabetes | 1026 | # of targets in HUGO gene set | 25254 | Switch table detail |
|---|
| Rank | PathwayID | Title | t+ | t- | b+ | b- | p-value | t-ratio | b-ratio |
enrichment folds |
|---|---|---|---|---|---|---|---|---|---|---|
| 1 | hsa04510 | Focal adhesion - Homo sapiens (human) | 75 | 951 | 197 | 25057 | 2.36e-42 | 0.07 | 0.01 | 9.4 |
| 2 | hsa04210 | Apoptosis - Homo sapiens (human) | 49 | 977 | 83 | 25171 | 6.68e-35 | 0.05 | 0.00 | 14.5 |
| 3 | hsa04010 | MAPK signaling pathway - Homo sapiens (human) | 73 | 953 | 259 | 24995 | 4.29e-34 | 0.07 | 0.01 | 6.9 |
| 4 | 109582 | Hemostasis | 62 | 964 | 172 | 25082 | 4.54e-34 | 0.06 | 0.01 | 8.9 |
| 5 | hsa05215 | Prostate cancer - Homo sapiens (human) | 49 | 977 | 93 | 25161 | 3.78e-33 | 0.05 | 0.00 | 13.0 |
| 6 | hsa04920 | Adipocytokine signaling pathway - Homo sapiens (human) | 45 | 981 | 72 | 25182 | 5.99e-33 | 0.04 | 0.00 | 15.4 |
| 7 | hsa04910 | Insulin signaling pathway - Homo sapiens (human) | 53 | 973 | 137 | 25117 | 1.68e-30 | 0.05 | 0.01 | 9.5 |
| 8 | hsa05212 | Pancreatic cancer - Homo sapiens (human) | 42 | 984 | 74 | 25180 | 1.42e-29 | 0.04 | 0.00 | 14.0 |
| 9 | 168256 | Signaling in Immune system | 72 | 954 | 312 | 24942 | 5.52e-29 | 0.07 | 0.01 | 5.7 |
| 10 | hsa05222 | Small cell lung cancer - Homo sapiens (human) | 43 | 983 | 87 | 25167 | 2.28e-28 | 0.04 | 0.00 | 12.2 |
Full result (HTML, TXT, EXCEL) Back to top
|
|
Protein-Protein Interaction Network |
The following table summarizes the targets (from the ROS-Diabetes set) that were used in this PPI network analysis. Background set is the source of the target frequency information for random network generation. For more detail, refer to the Network Significance Test below.
| Corpus size | # of targets (total) | # of targets (used) | |
|---|---|---|---|
| ROS-Diabetes | 1154 | 1026 | 1026 |
| Background set | 25254 | 25254 |
Interaction Network Within Corpus (sorted by degree)
[TABLE] Here is a summary table of the Protein-Protein Interaction network data of the test set. This table basically shows how many targets are interacting each other within the test set.
| Num of PMIDs | 1154 |
|---|---|
| Num of genes (total) | 1026 |
| Num of genes (used) | 1026 |
| Num of targets with any interaction | 983 |
| Num of targets interacting within corpus | 879 |
| Num of direct interaction within corpus | 5002 |
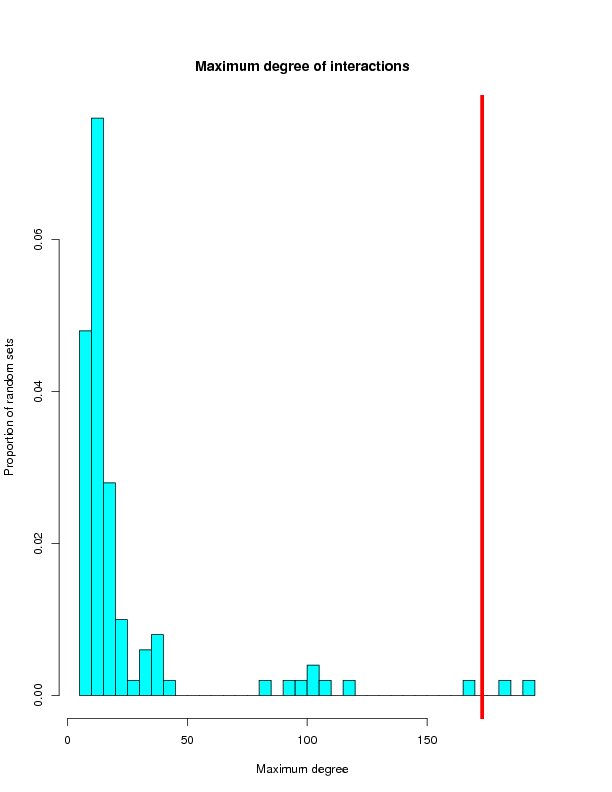
| Maximum degree target | HNF4A (Degree = 173) |
| Minimum degree target | SLC7A2 (Degree = 1) |
[TABLE] Top 10 interacting targets within the test set
| Rank | Target Symbol | Num of Direct Interactions | MiMI Network |
|---|---|---|---|
| 1 | HNF4A | 173 |  |
| 2 | JUN | 106 | |
| 3 | MYC | 102 | |
| 4 | TP53 | 82 | |
| 5 | MAPK1 | 77 | |
| 6 | SRC | 75 | |
| 7 | RELA | 74 | |
| 8 | PRKCA | 72 | |
| 9 | EGFR | 70 | |
| 10 | MAPK3 | 62 | |
| View your full list in a TEXT or EXCEL file. |
|
View the full merged network in cytoscape SIF (MiMI Network File). This file has to be downloaded first and imported into a Cytoscape program. |
Network Significance Test (100 iteration of random genes with size of 1026 from total of 25254 genes)
This Network Significance Test section will test the integrity of the Protein-Protein Interaction network among the test set targets. This is based on the assumption that targets commonly related to a certain topic will be more likely to have frequent protein-protein interaction with each others. Therefore, if a set of targets identified by text-mining (SciMiner) from a certain query have more frequent direct interactions among the targets compared to randomly generated sets, it can, in part, support the validity of using text-mining method to identify related targets from a set of related papers. 100 random network of the same number of target in the test set will be generated from the background set. The test set had 1026 targets. Thus 1026 are randomly selected from the background which had a total of 25254 targets. If the background set was full HUGO set, all the targets will have an equal chance of being selected. If the background set was either Selected background above or Whole document in SciMinerDB, the probability of each target begin selected is determined by the observed frequency of each target as in (# of papers with the target / # of all papers).Two statistical measures are given below; standard Z-test and one-sample T-test.
| Targets with any interaction | Targets interacting within corpus | Direct interactions within corpus | Max degree | |
|---|---|---|---|---|
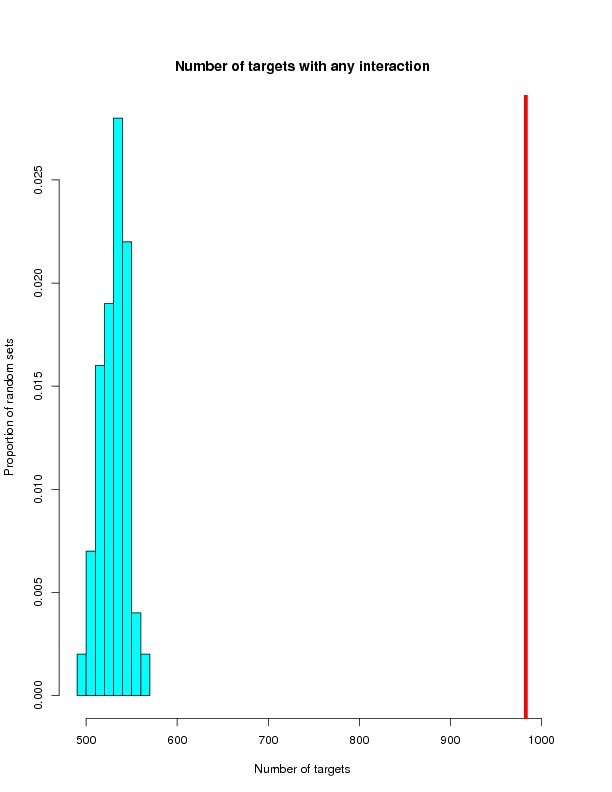
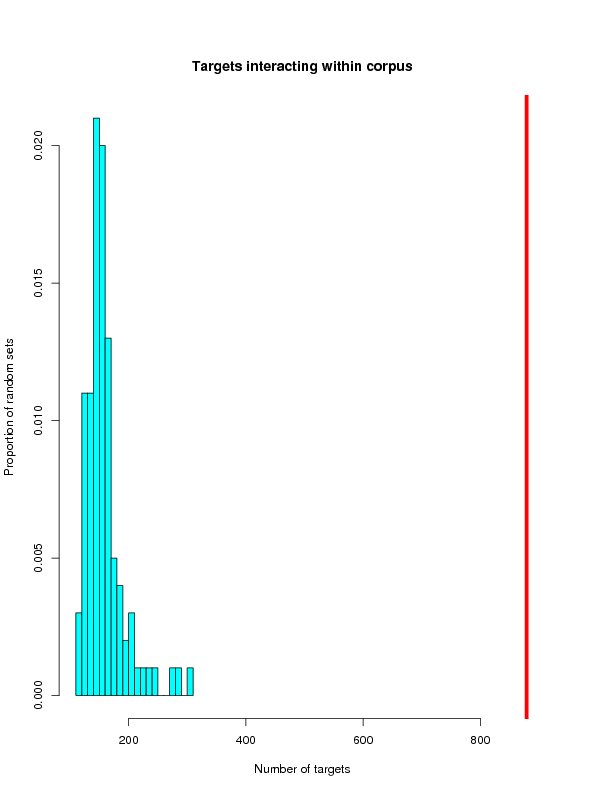
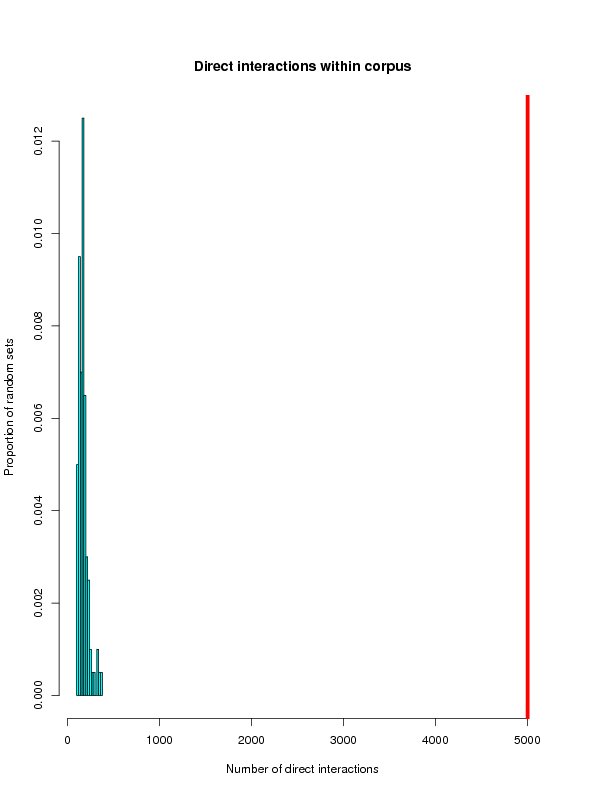
| Tested | 983 | 879 | 5002 | 173 |
| Mean | 529.75 | 158.59 | 171.41 | 25.10 |
| STDEV | 14.76 | 34.00 | 51.47 | 35.93 |
| Z-Score | 30.7 | 21.2 | 93.9 | 4.1 |
| P-value(Z) | 0.0e+00 (0.000) | 0.0e+00 (0.000) | 0.0e+00 (0.000) | 1.9e-05 (0.000) |
| T-Stat | -307.0 | -211.9 | -938.5 | -41.2 |
| P-value(T) | 2.7e-149 (0.000) | 2.3e-133 (0.000) | 2.6e-197 (0.000) | 4.4e-64 (0.000) |
Distrubution of randomly generated networks
This section will histograms of the random network samples. Red bars represent the targets from the ROS-Diabetes set (target query) being tested.
Back to top
Targets with any interaction
Targets interacting within corpus
Direct interactions within corpus
Max degree